Hello Lovely People!
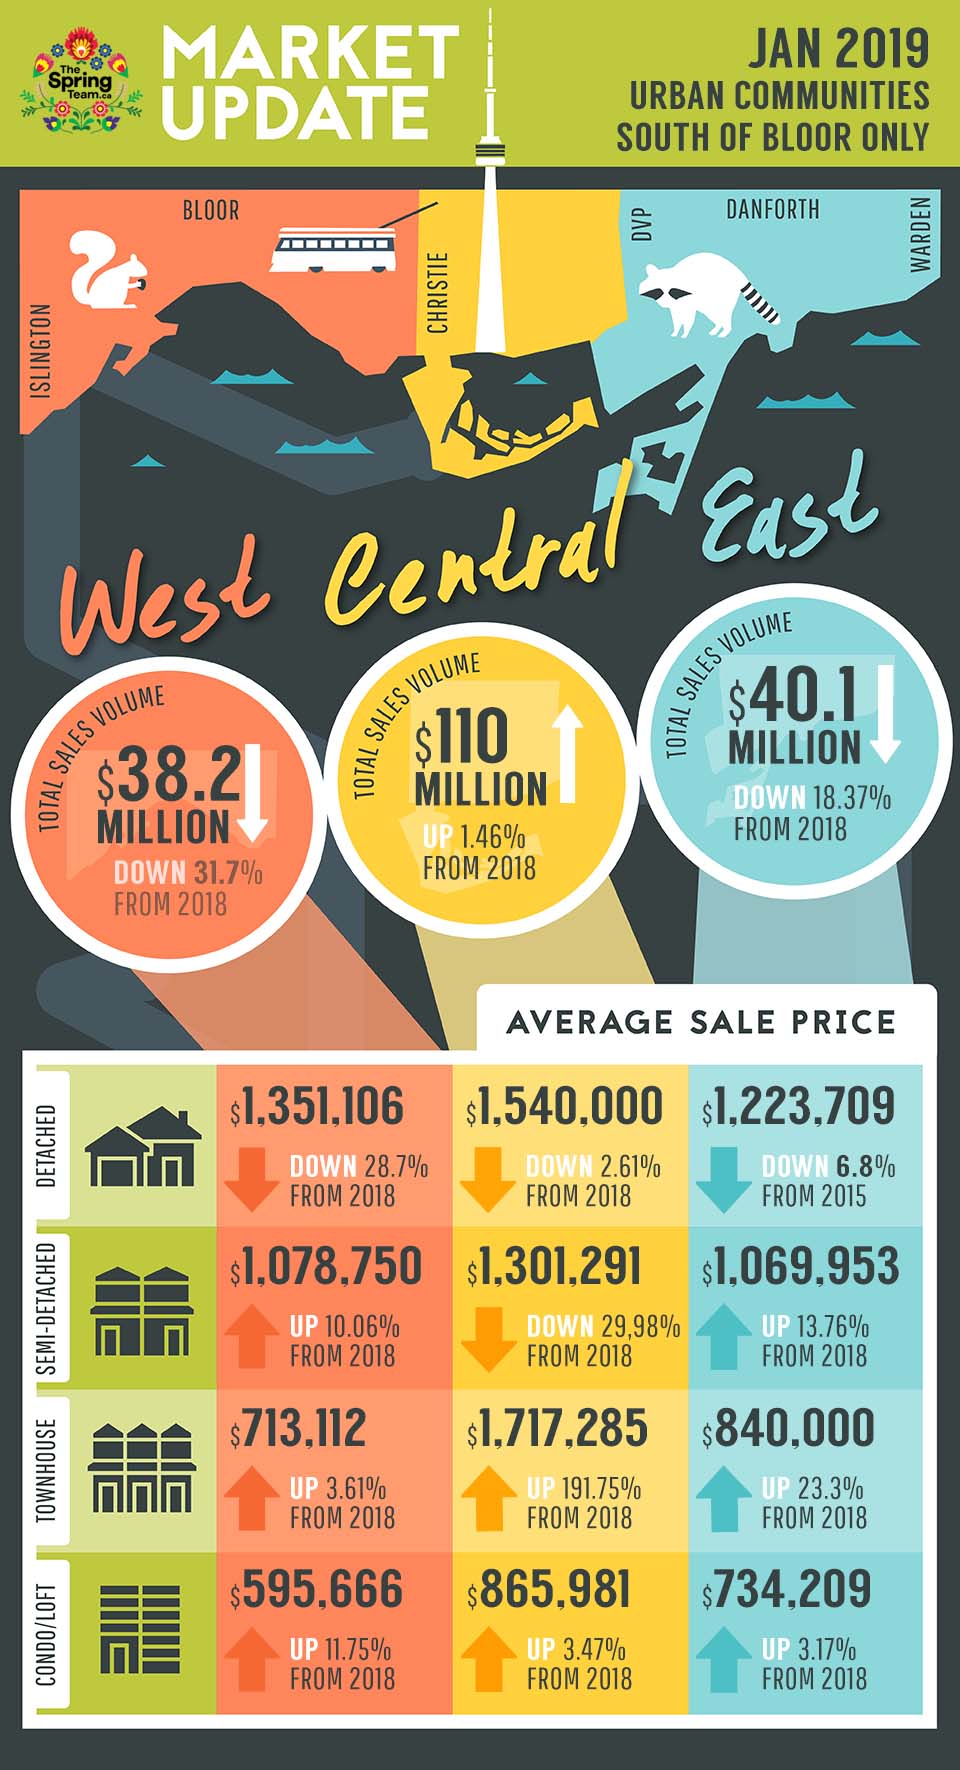
How’s everyone doing today? It’s been a while since I put forward a market update and am committed to do one monthly starting now so here we go! [infographic at the bottom or you can download and view a PDF version here]
Now we’ll have the February numbers in a couple weeks. But here’s a deep dive into the urban markets of Toronto for January compared year over year. Remember this is only for Toronto’s Urban Communities South of Eglinton East of Etobicoke West of Scarborough. These markets are generally performing similarly so the numbers here won’t be skewed by the underperforming suburban markets.
So How’s The Market, you ask? Read on
As we move into the latter third of Q1 2019 we’re seeing some serious momentum in our market across the board. Perhaps fuelled by the announcement of Netflix’s new production facility along Eastern Ave, the 50,000 new jobs that East Harbour will provide or even Sidewalk Lab’s announcement to expand their plans for our waterfront.
It’s not all rosy though as Detached homes dipped 12.7% from East to West on average but that’s because Buyers are pickier than ever. Quality freehold product that’s presented well is still performing very well especially in the $1.5 to $2.5mm range. It’s the lower quality, less finished product that is dragging down the urban average.