Week 166: Toronto’s Real Estate Market: Unpacking Surprises and Predicting Shocks
Happy week 166, so what’s going on in the market today? Well, if you look at the numbers below when I just want to make sure everybody knows that you know there might be a lot of writing here, but if you scroll down, we’ve got a whole bunch of charts that have been ongoing since March 2020 and precise neighbourhood information on the five neighbourhoods that I have been tracking since March 2020
These numbers below are so important because they stand out from the general numbers that the Toronto regional real estate board releases every month.
When you hear all of this talk about average prices, and this is up and down, it’s tough to understand what that means for you in your specific communities; you see, in Toronto real estate, it’s tough to be a generalist, jumping from one community to the other; however, it becomes a lot easier when you understand how do you extract very specific neighbourhood data so when you are exposed to a new community That our clients are interested in, we can quickly get up to speed with what’s going on in those neighbourhoods without relying on the general and usually unreliable data that is released monthly.
So if you’re reading any real estate content or listening to any real estate content, the opening line is, and the April numbers are out. It’s a week or two into May you can guarantee that what you’re about to hear is irrelevant.
So what’s happening in the Toronto real estate market is interesting and unsurprising.
As I said repeatedly, this market heated up much quicker than I or anyone else expected.
There’s still a lot of economic uncertainty out there. Still, it seems as though people in many major cities throughout Canada have said: “screw it. I’m gonna continue to spend money,” and they’re doing it with higher interest rates.
They’re showing up to the offer table over and over again, offering big numbers, some similar numbers to the insanity of January, February and March 2022
But the big difference is that today, we’re talking about fixed mortgage rates at around the high fours with variable products in the 5 1/2 to 5.9% range, depending on whether there is CMHC coverage.
That equates to a difference of thousands of dollars a month that buyers are OK with for now.
So this optimism that’s in the air right now, I believe, is slowly starting to fade or will gradually begin to fade a lot sooner than the dead of summer.
Just like the market heated up much quicker in 2023 than anyone expected, it will slow down much faster than the typical summer lol that I’ve been talking about over the past few weeks.
So there is still an excellent opportunity for homeowners to get to market right now, whether you own a condo or a house. Still, if you look at the numbers below, you’ll see that the housing supply has increased tremendously over the past four weeks, and all of that condo supply that was absorbed last week has come back.
And looking at the months of inventory or MOI data below, which I just refreshed today after all of the April numbers had settled, you’ll see it’s up across the board, reflecting lower sales numbers from the previous incredibly slow months.
So generally, if you’re a buyer today, you’re still likely competing for a lot of that hot product. Still, you may also notice some places not selling on offer night as expected and being relisted the next day at a higher, more reasonable price waiting for the appropriate buyer.
Condos, on the other hand, are still performing very well despite the replenished supply, but when you look at the actual demand side of things, optimism is still there; buyers are still buying, so we don’t expect too many changes in the next 2 to 3 weeks however, as we head into June, we may see things start to slow down, and buyers pull back a little bit.
June 7 is the next Bank of Canada announcement. It’s a critical date because if there’s any negative news or even a 25 basis points increase, I think that’ll take the wind out of many buyers’ sales and have them hibernate for a little while.
So as a seller, you need to get to market right now if you have to for condos and houses.
The good news is whatever lol is ahead of us is not some sort of long-term bubble-bursting type of situation that you’re probably going to read about, especially if you’re following some uneducated creators on social media who love to dramatize very normal situations and if you’re following me on TikTok, I called one of those people out just yesterday who decided that they would lie about a property that was recently sold that was listed for $1 million. Still, the deal was reported out over $10 million, and any normal person would’ve realized that it was a clerical error, but no, not this person; they decided to dig in and say, “I spoke to people involved in the transaction, and it’s true.”
In reality, it took me 30 seconds to find out that it wasn’t true because I texted the buyer’s agent, and he told me that it wasn’t true and that it was a mistake they were about to fix.
So the lesson here is that there’s always more to the story headlines will always be designed to get you to continue to pay attention to whatever publication is offering. Usually, the content beyond the headline is actually quite valuable.
Still, a lot of people, unfortunately, tend to just focus on the headlines, so there will be some interesting headlines in the coming month or two but stick to this blog stick with me and will cut the drama out of what is a very serious and normal market with a lot more predictability then we are all led to believe.
So please look at the numbers in the charts below, and let’s have a conversation.
And if you’d like to book a call to discuss your specific real estate needs, you can do that here, and I really look forward to helping you.
Have a wonderful day, and I’ll see you next week. Don’t forget to subscribe to the blog so you get this in your inbox asap, and we’ll see you on Youtube!
(please subscribe to the YouTube Channel here, where I go over all of these reports in more detail)
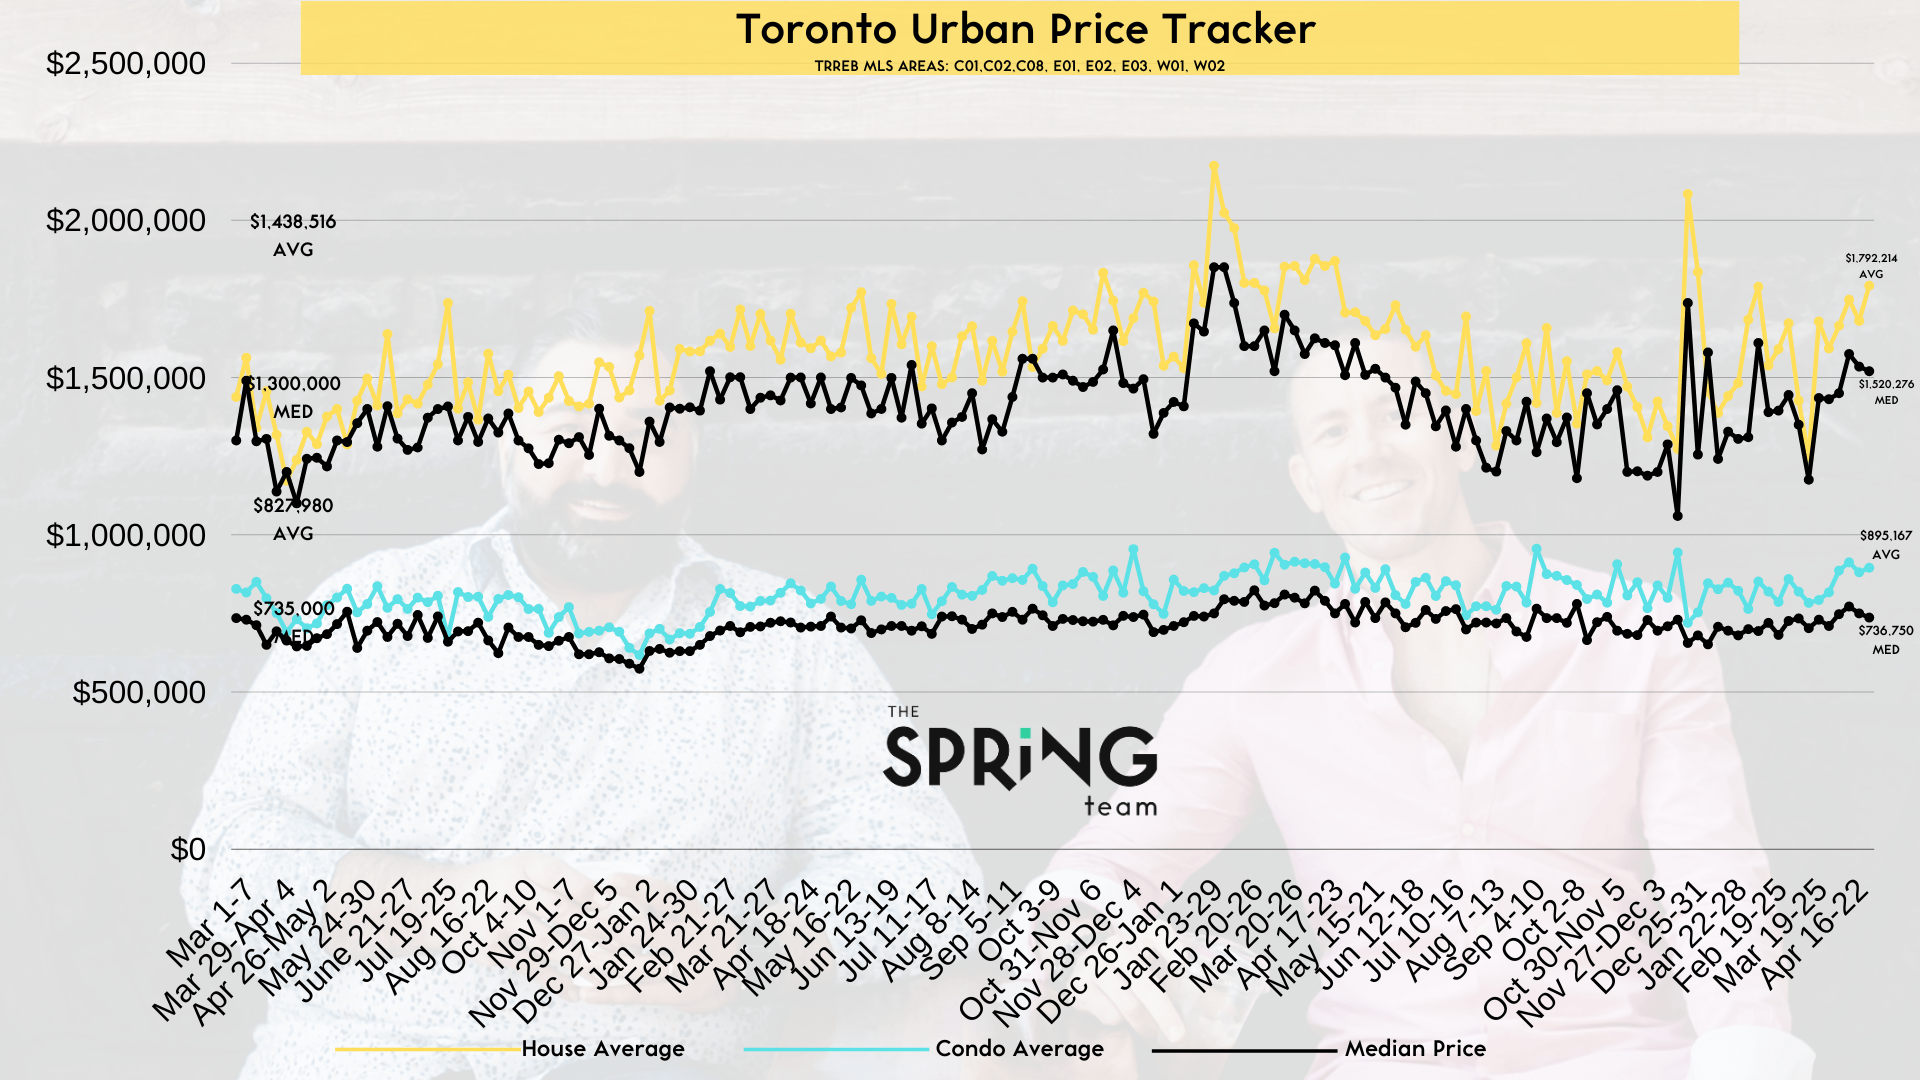
Urban Markets: Downtown & Surrounding Areas
House Average Price: $1,792,214
House Median Price: $1,520,276
460 Active Listings
78 Firm Sales This Week
Months of Inventory (MoI) ~ 2.04 (up from 1.69 last month)
Average Days on Market ~ 13.20
Condo Average Price: $895,167
Condo Median Price: $736,750
1448 Active Listings
148 Firm Sales This Week
MoI ~ 2.81 (up from 2.67 last month)
Average Days on Market (DOM) ~ 17.3
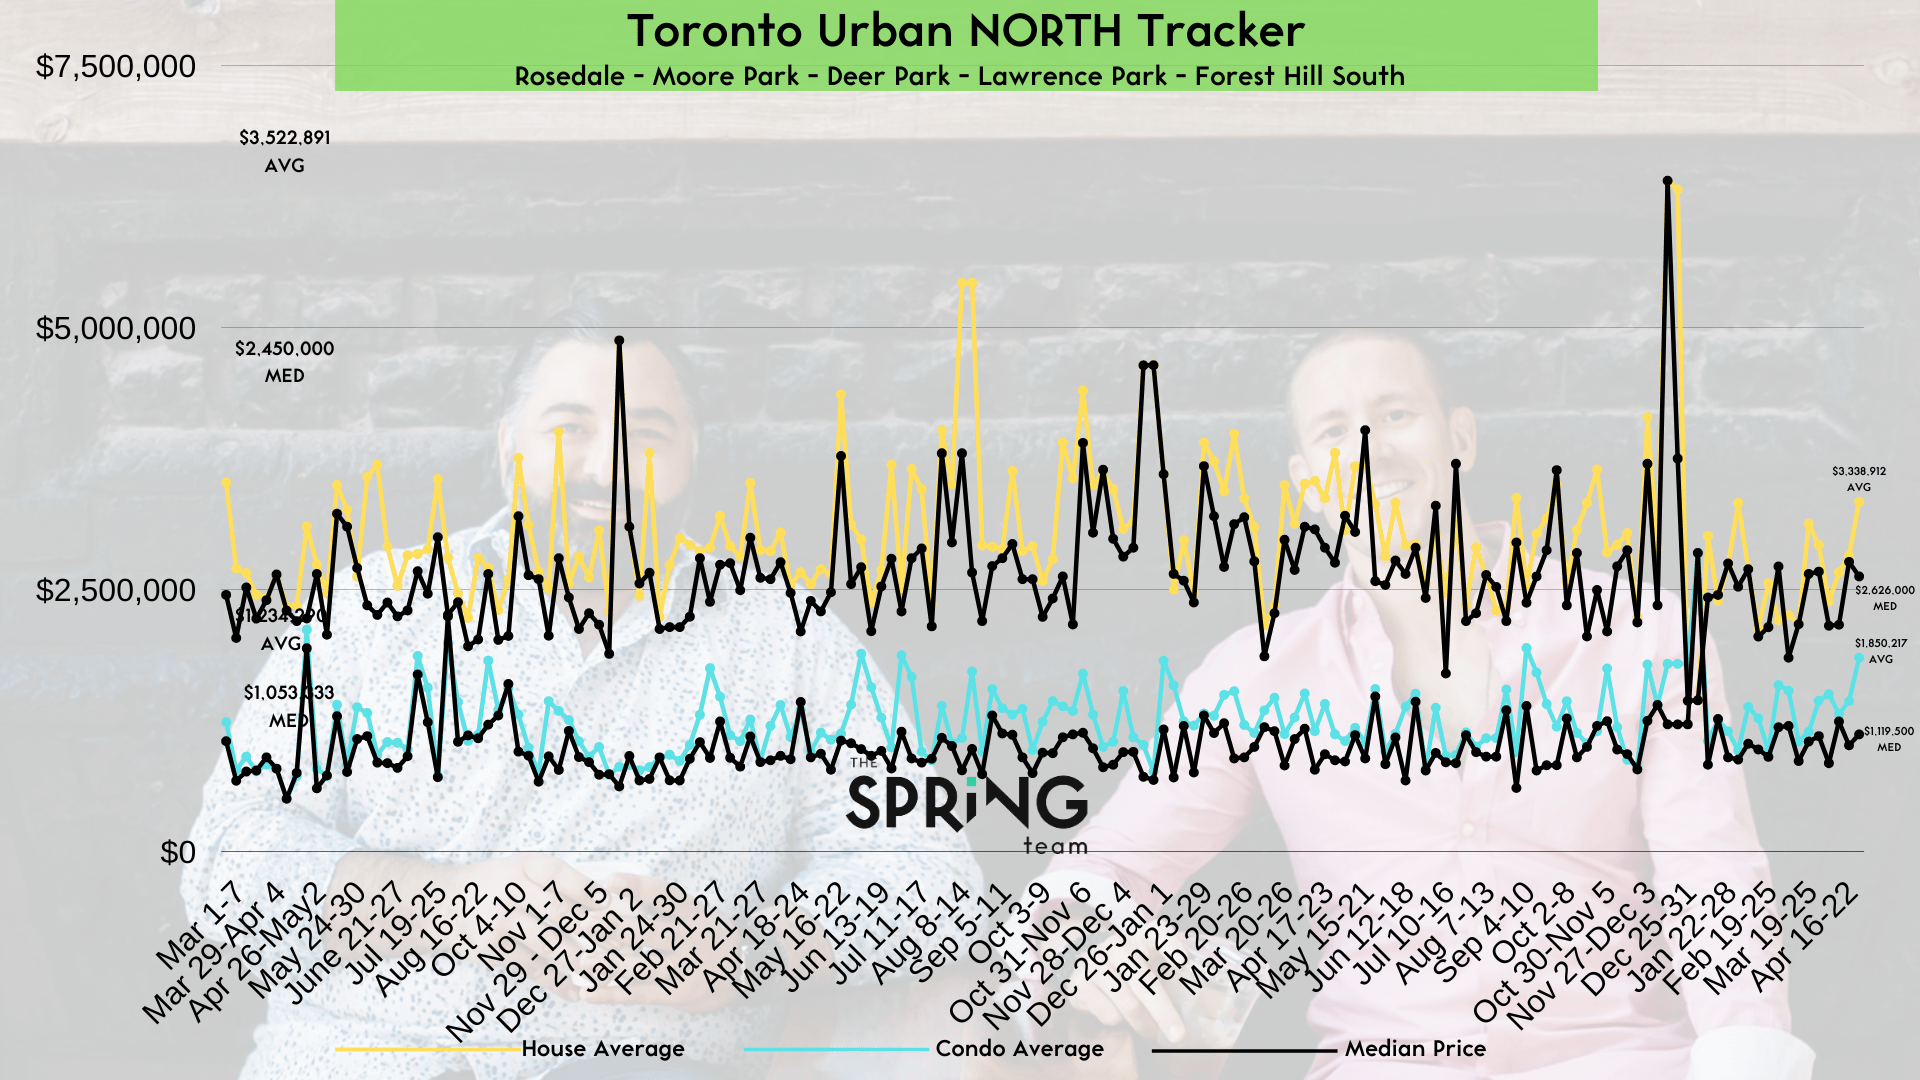
Urban North: Rosedale, Deer Park, Moore Park, Forest Hill, & Lawrence Park
House Average Price: $3,338,912
House Median Price: $2,626,000
138 Active Listings
17 Firm Sales This Week
MoI ~ 3.11 (up from 2.40 last month)
Average Days on Market ~ 17
Condo Average Price: $1,850,217
Condo Median Price: $1,119,500
216 Active Listings
18 Firm Sales This Week
MoI ~ 4.05 (up from 3.76 last month)
Average Days on Market ~ 23
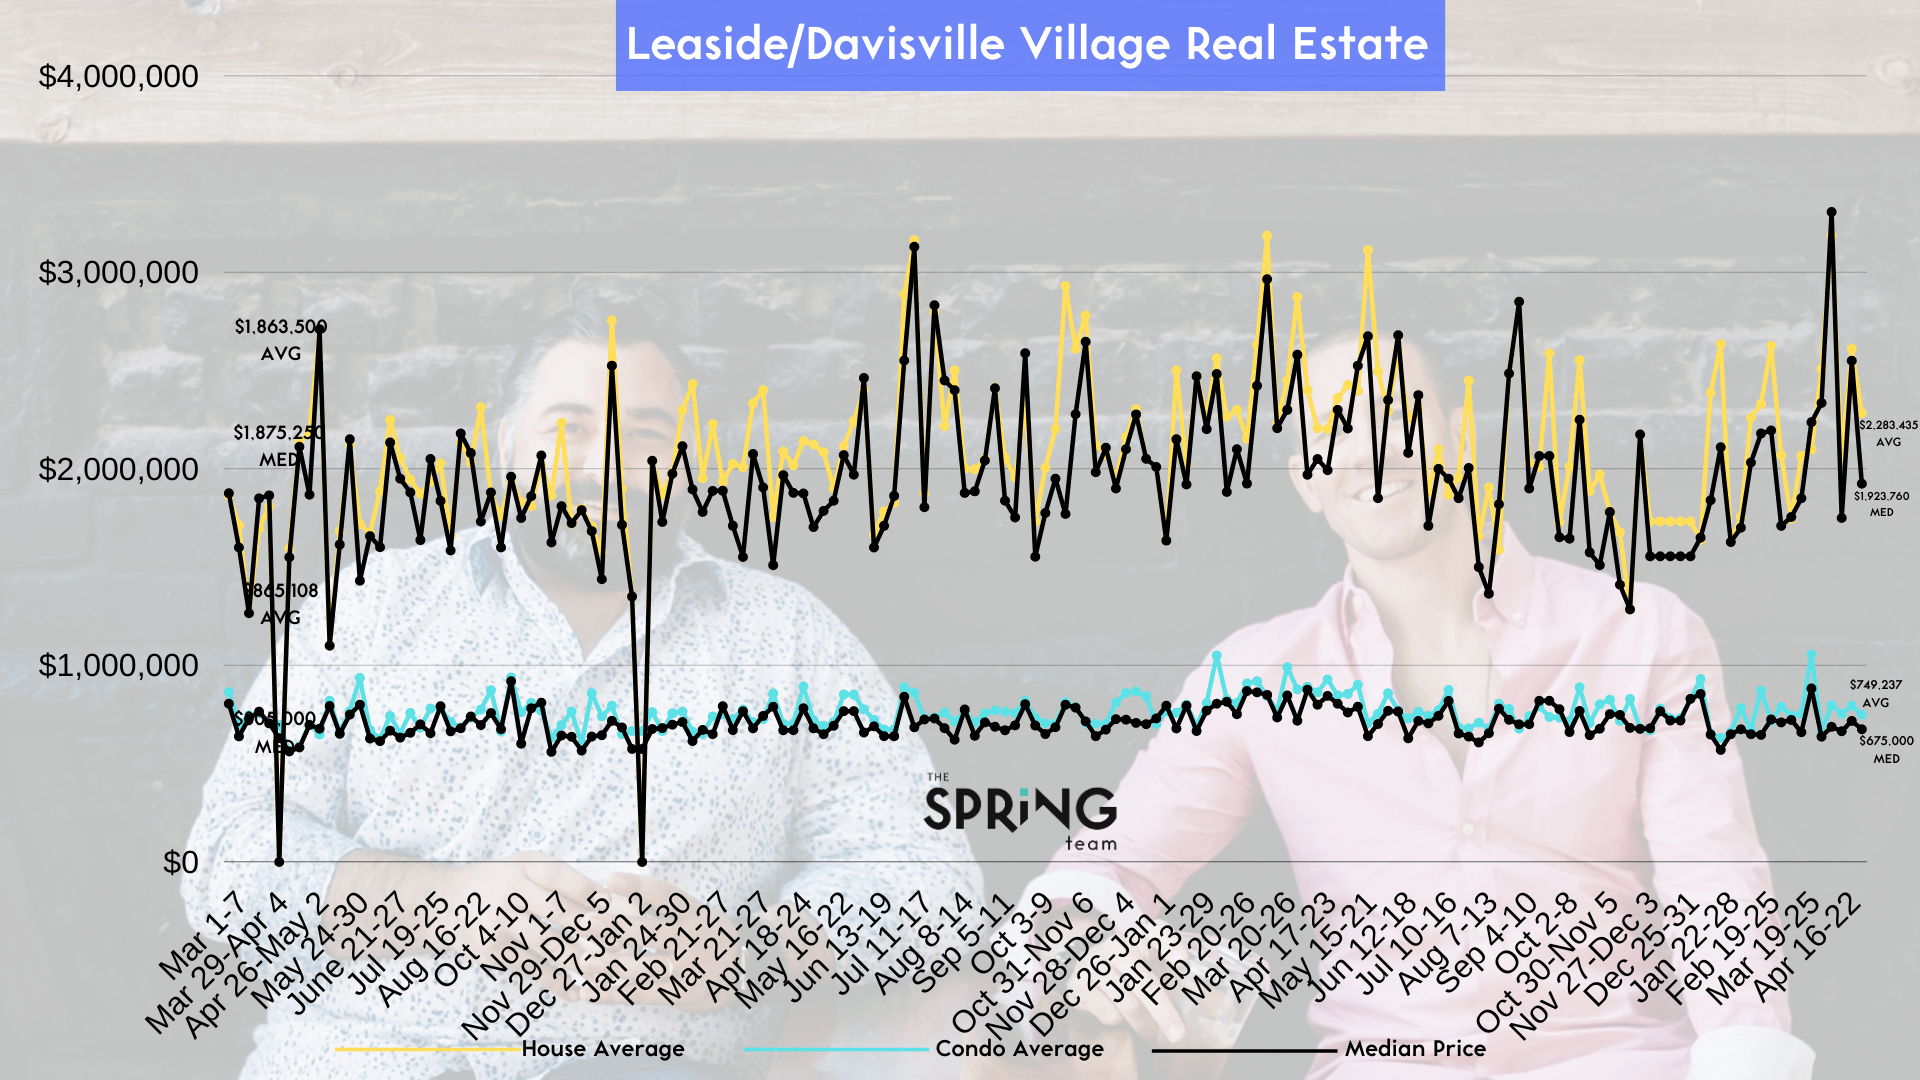
Leaside, Davisville, Yonge & Eglinton
House Average Price: $2,283,435
House Median Price: $1,923,760
39 Active Listings
10 Firm Sales This Week
MoI ~ 1.43 (up from 1.14)
Average Days on Market 8.5
Condo Average Price: $749,237
Condo Median Price: $675,000
136 Active Listings
16 Firm Sales This Week
MoI ~ 2.75 (up from 2.43 last mth)
Average Days on Market ~ 19
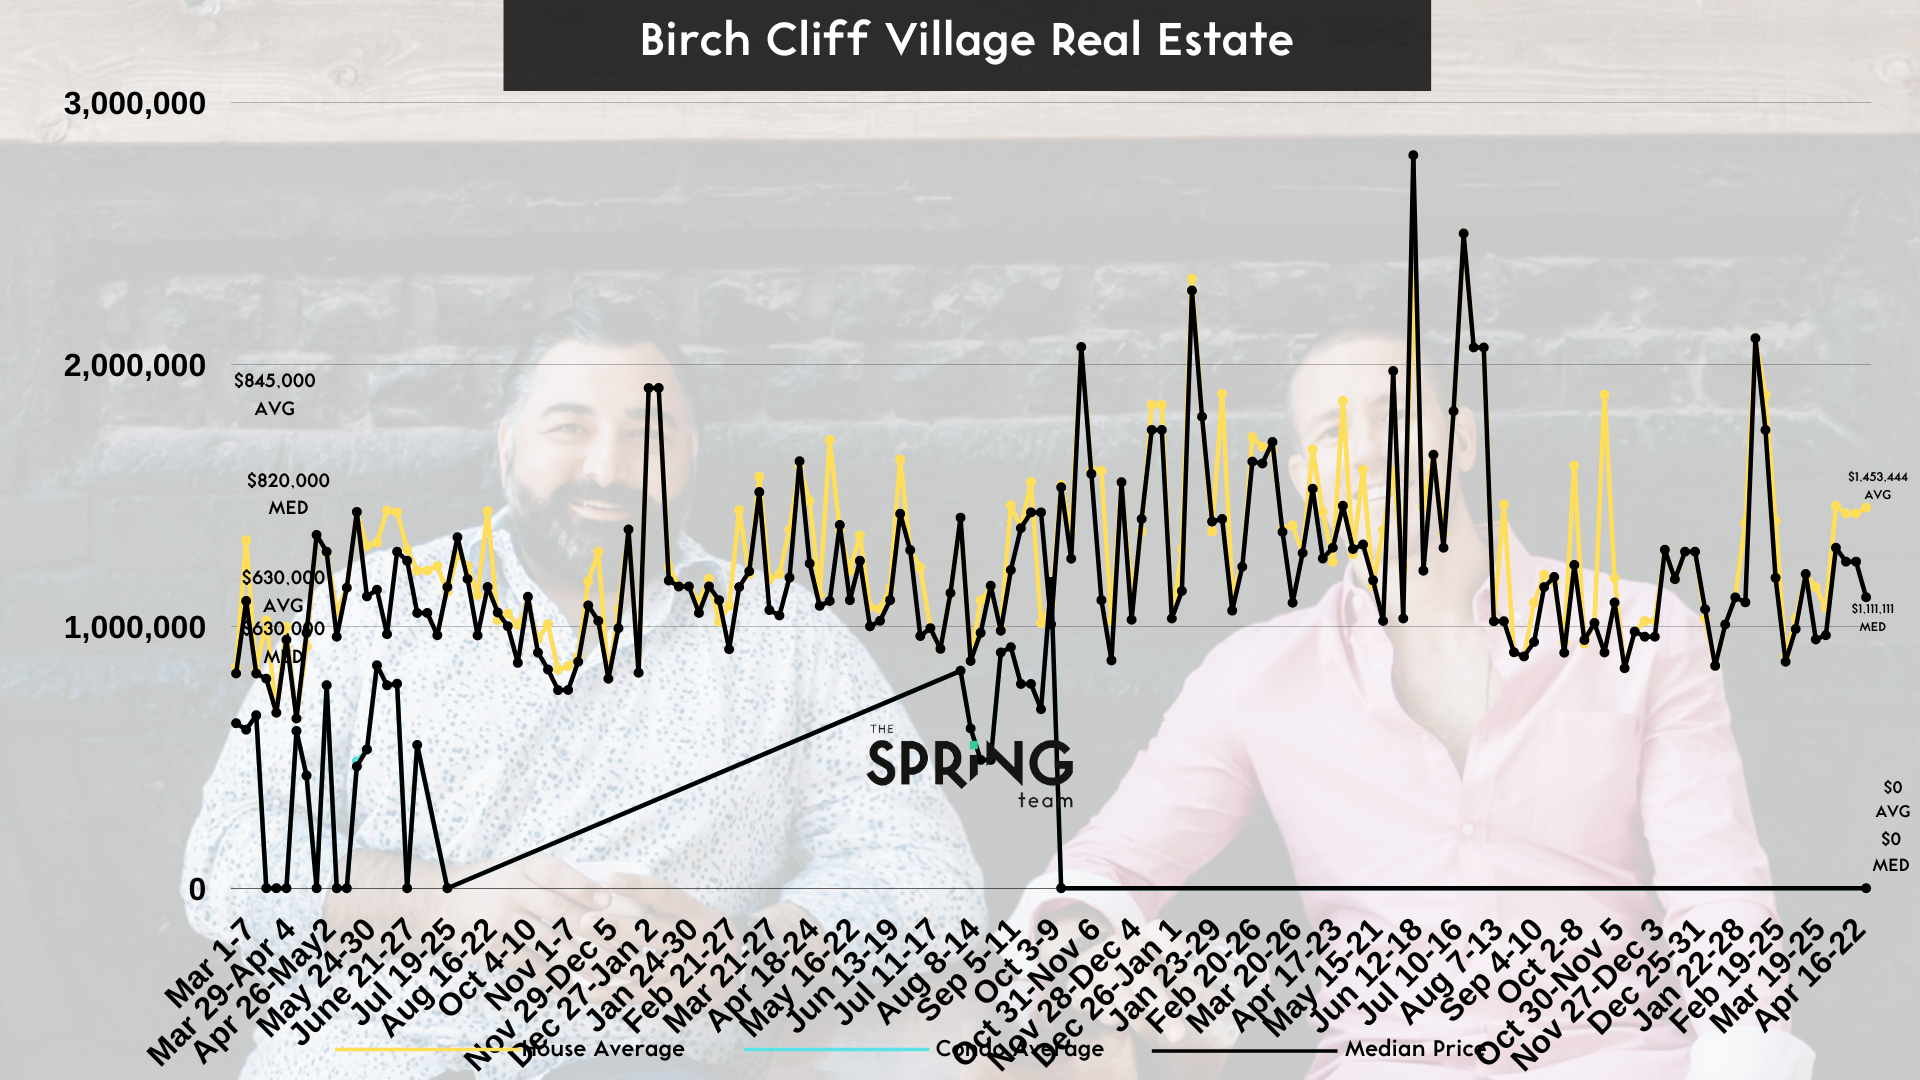
Birch Cliff
House Average Price: $1,453,444
House Median Price: $1,111,111
27 Active Listings
7 Firm Sales This Week
Months of Inventory (MoI) ~ 1.76 (up from 1.05)
Average Days on Market ~ 8
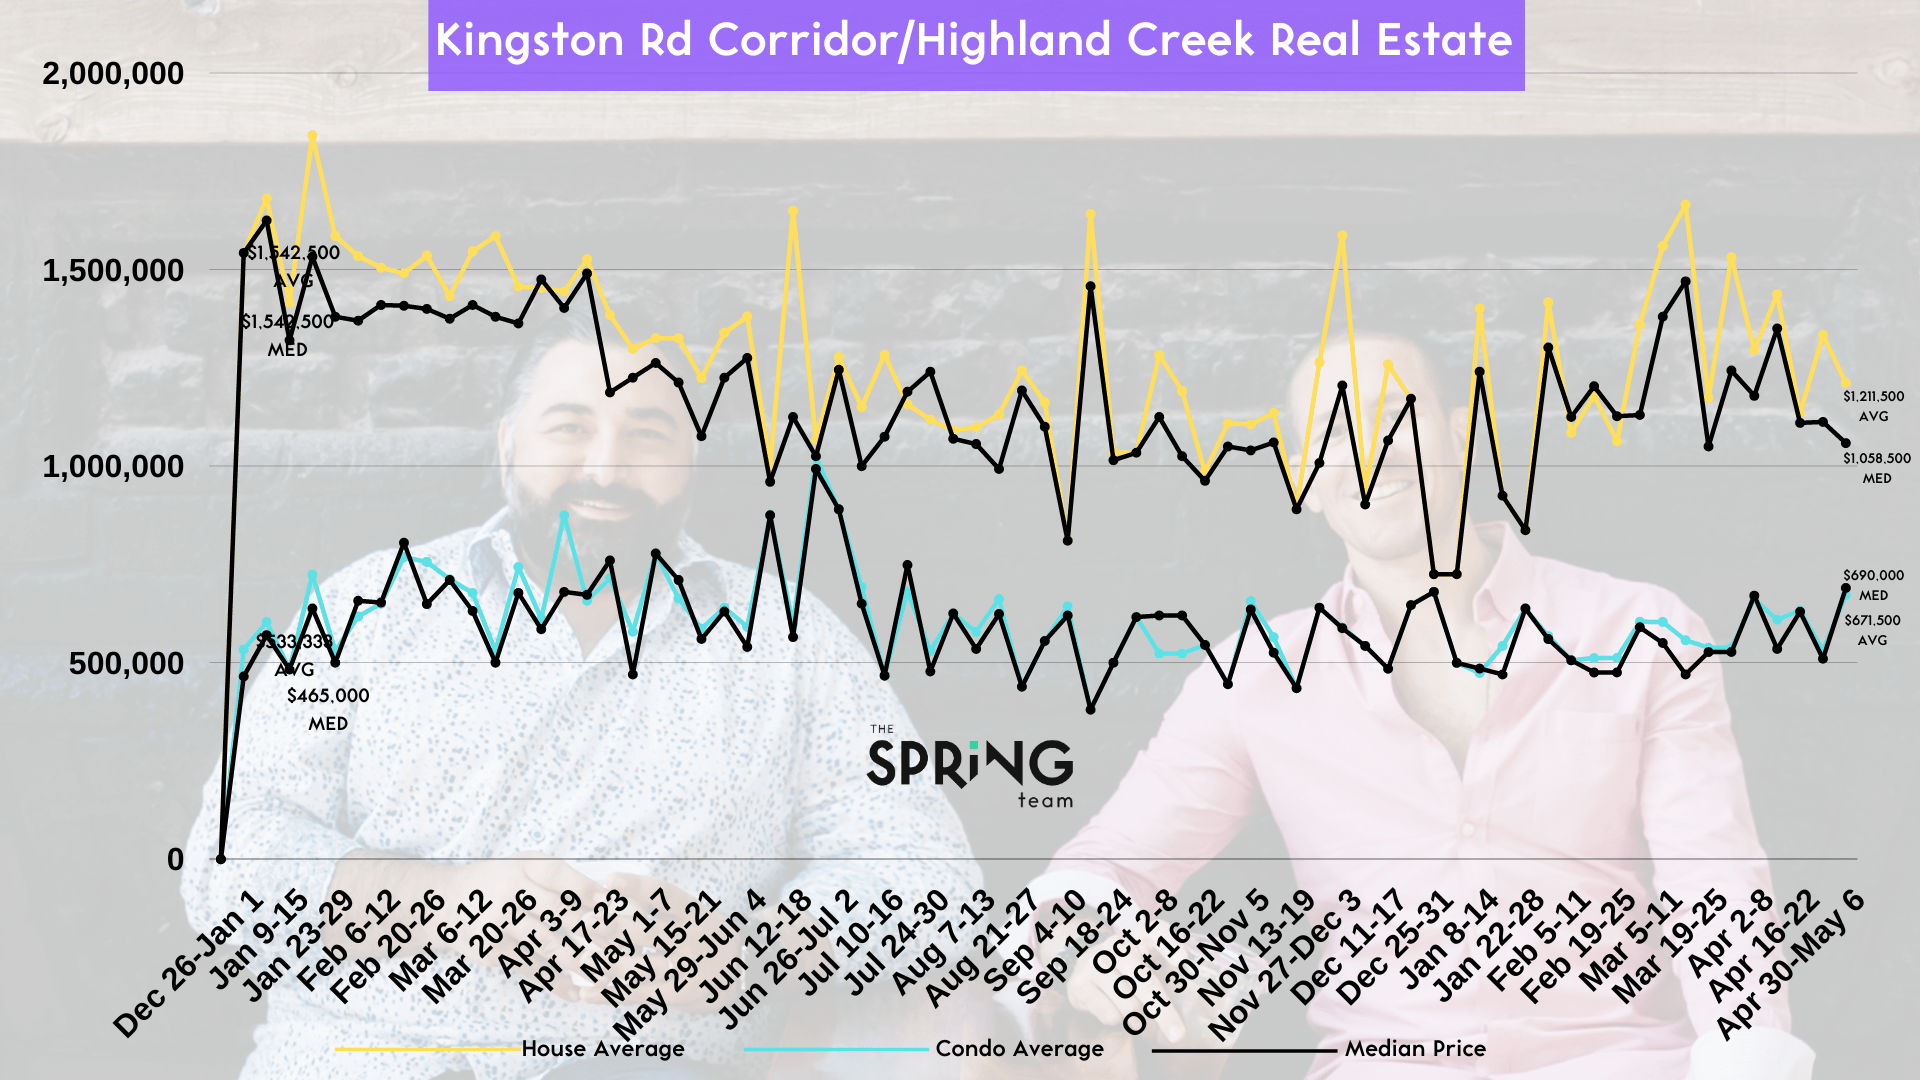
Kingston Rd Corridor to Highland Creek
House Average Price: $1,211,500
House Median Price: $1,058,500
61 Active Listings
8 Firm Sales This Week
Months of Inventory (MoI) ~ 1.71 (up from 1.66)
Average Days on Market ~ 7
Condo Average Price: $671,500
Condo Median Price: $690,000
41 Active Listings
4 Firm Sales This Week
MoI ~ 3.30 (up from 2.76)
Average Days on Market ~ 30