Week 155: Dead Cat Bounce or is the Toronto Real Estate market back?
I despise the day trader mentality when talking real estate, but my former business partner asked me if I thought this was a “dead cat bounce” the other day, and I thought it was a good way to talk about what we’re seeing in the market today.
Traders use the team “Dead Cat Bounce” to describe when a falling stock has a rally that some think is the return of the bull run, but in reality, it’s a quick run-up in stock price before it comes back down again or flatlines.
Investopedia defines it as: “A dead cat bounce is a short-term recovery in a declining trend that does not indicate a reversal of the downward trend. Reasons for a dead cat bounce include a clearing of short positions, investors believing the bottom has been reached, or investors that find oversold assets.”
Do I think we’re currently experiencing a “dead cat bounce” in Toronto real estate?
Yes and No.
Let me explain. (continued after chart)
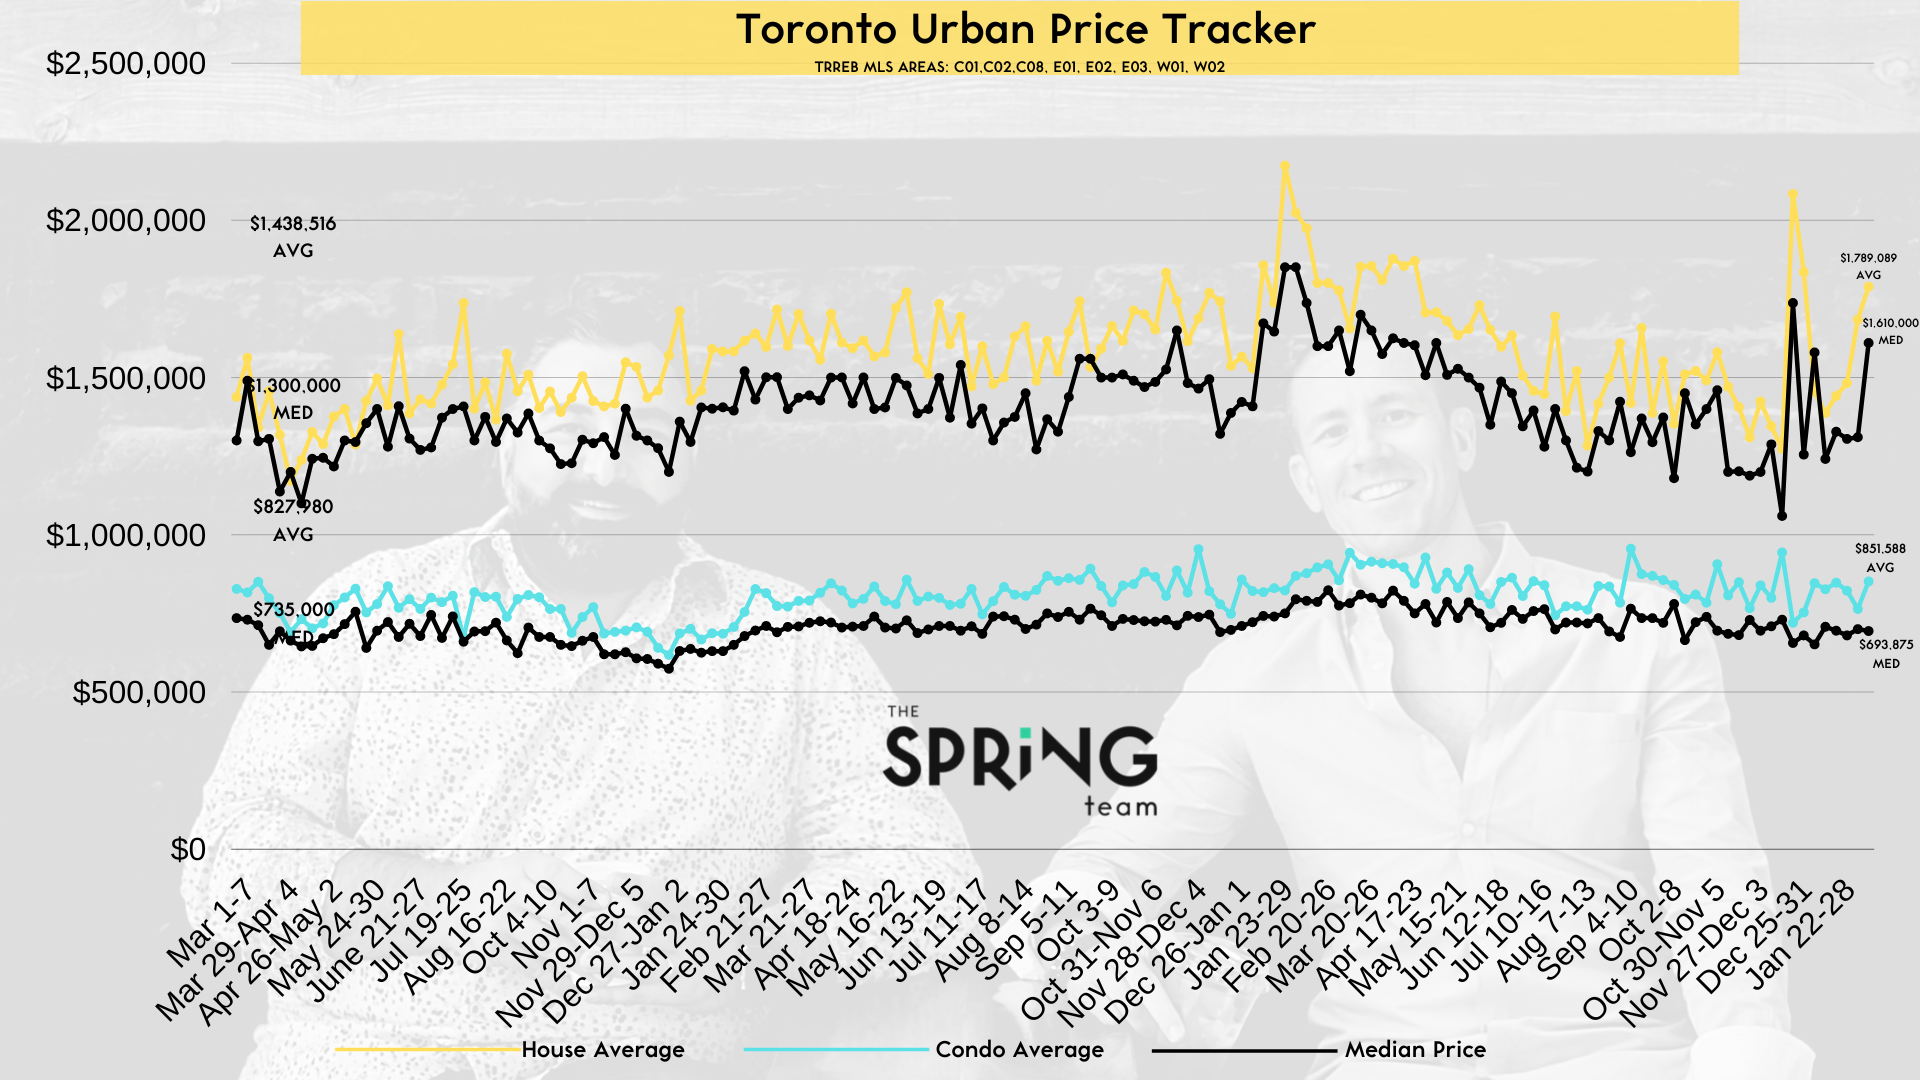
Urban Markets: Downtown & Surrounding Areas
House Average Price: $1,789,089
House Median Price: $1,610,000
332 Active Listings
47 Firm Sales This Week
Months of Inventory (MoI) ~ 1.22 (up from 0.94 last month)
Average Days on Market ~ 18.51
Condo Average Price: $851,588
Condo Median Price: $693,875
1320 Active Listings
84 Firm Sales This Week
MoI ~ 2.16 (up from 1.81 last month)
Average Days on Market (DOM) ~ 24.61
No, because I don’t think we’re in for another slide further than we’ve already experienced.
The true bottom of the market is behind us, and we have a light at the end of the tunnel for rates to come down and buyers to start feeling better about being in the market.
By the end of this year, we should start seeing today’s optimism again.
Here’s how I see the next few months playing out.
After the January 25th announcement, where we had a small 25bps increase for the first time since March of 2022, buyers came back with eyes wide with a little more certainty in the future. The BoC hinted that they’d consider NOT hiking rates further at the March announcement IF a few things lined up.
But stronger-than-expected employment numbers for Canada and the US quashed any hope of halting the hike cycle.
(continued after chart)
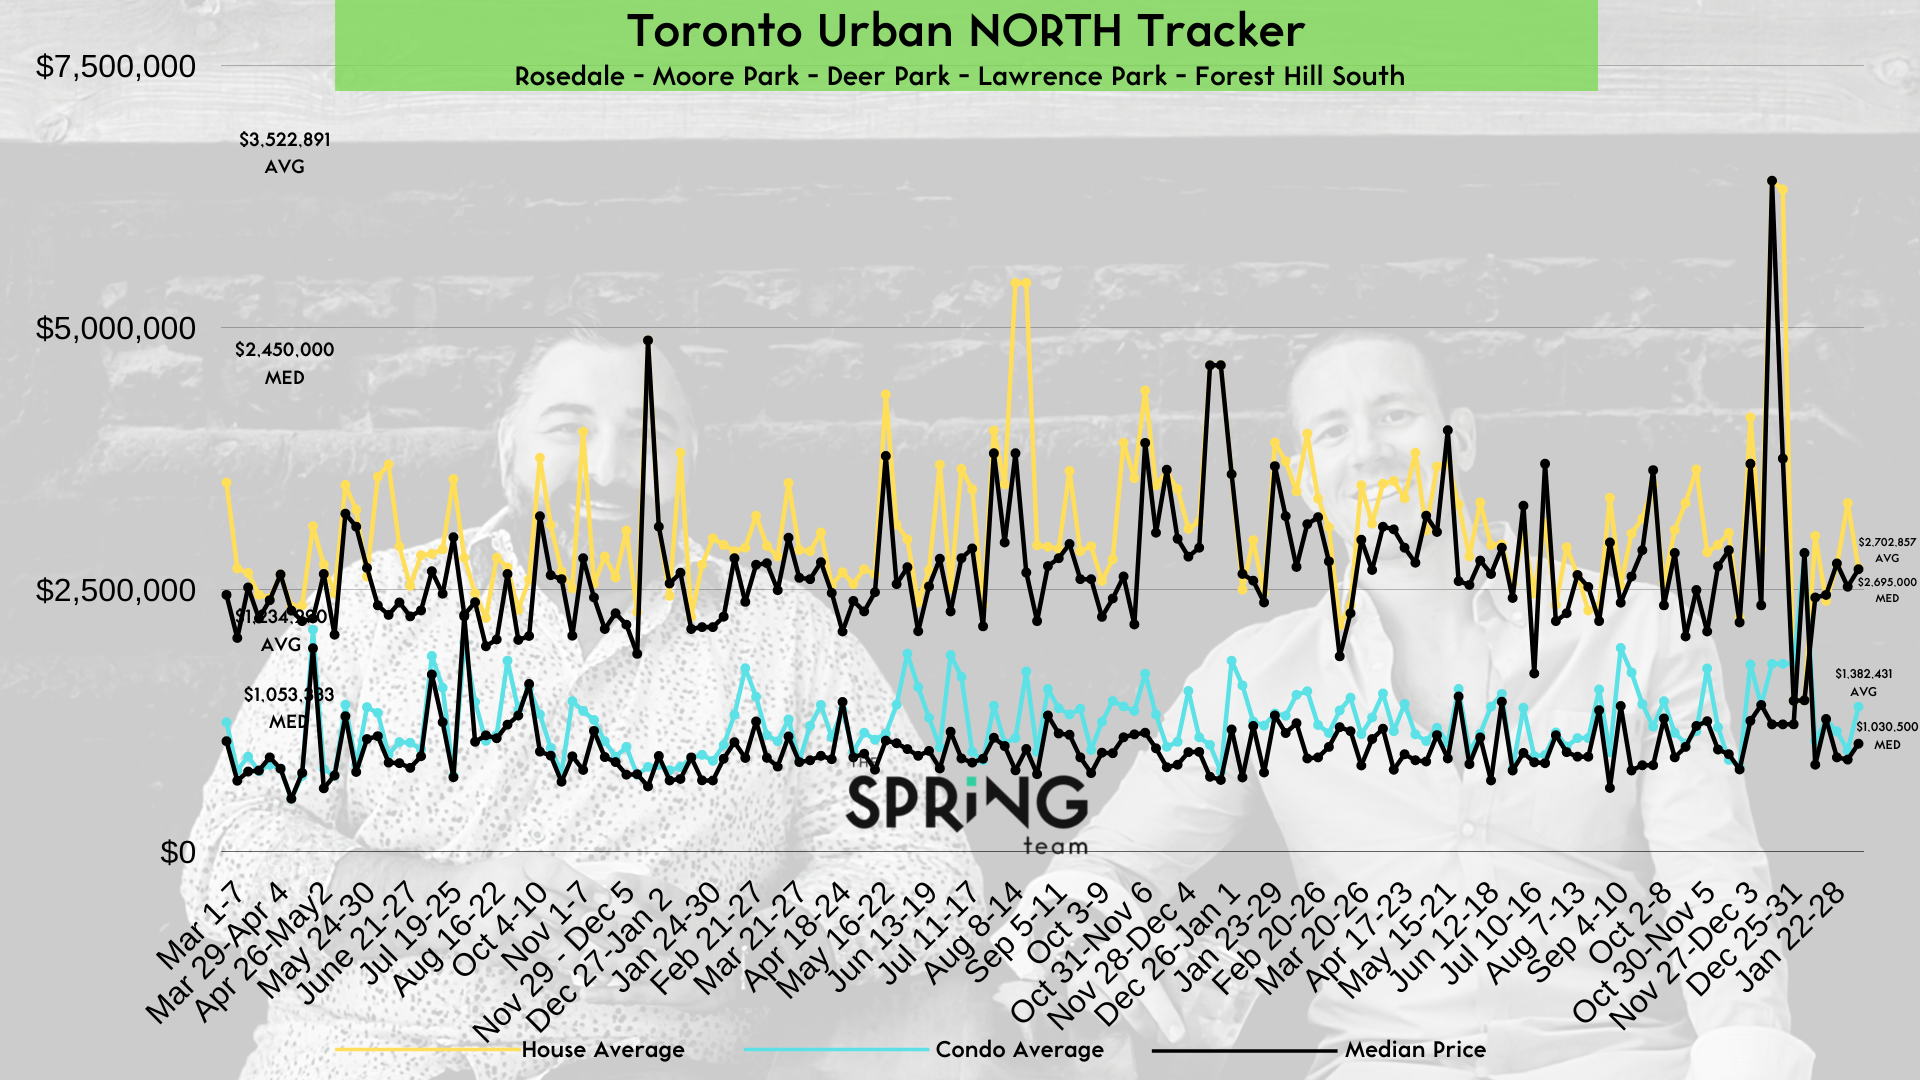
Urban North: Rosedale, Deer Park, Moore Park, Forest Hill, & Lawrence Park
House Average Price: $2,702,857
House Median Price: $2,695,000
105 Active Listings
7 Firm Sales This Week
MoI ~ 1.84 (up from 1.65 last month)
Average Days on Market ~ 13.71
Condo Average Price: $1,382,431
Condo Median Price: $1,030,500
202 Active Listings
10 Firm Sales This Week
MoI ~ 2.85 (up from 2.14 last month)
Average Days on Market ~ 13.5
But I don’t think the news has settled with the common buyer yet. But remember, fixed rates came down slightly to under 5% in some cases, so buyers locked in and went shopping. And they’ll continue to do so until their rate holds expire.
The March announcement will come, and there should be another 25bps announcement. After which, there should be about 60 days of similar buying activity.
This is why I’ve been talking about the Seller window. If you have a place to sell, now’s the time. The window will close as we approach the Summer months, and we’ll be in a lull. A market lull similar to 2022, 2021, 2022. Nothing new here.
February employment numbers will come out after the March announcement and will be stronger than expected, which could result in another rate hike at the April announcement. That should put the market in a holding pattern again.
(continued after chart)
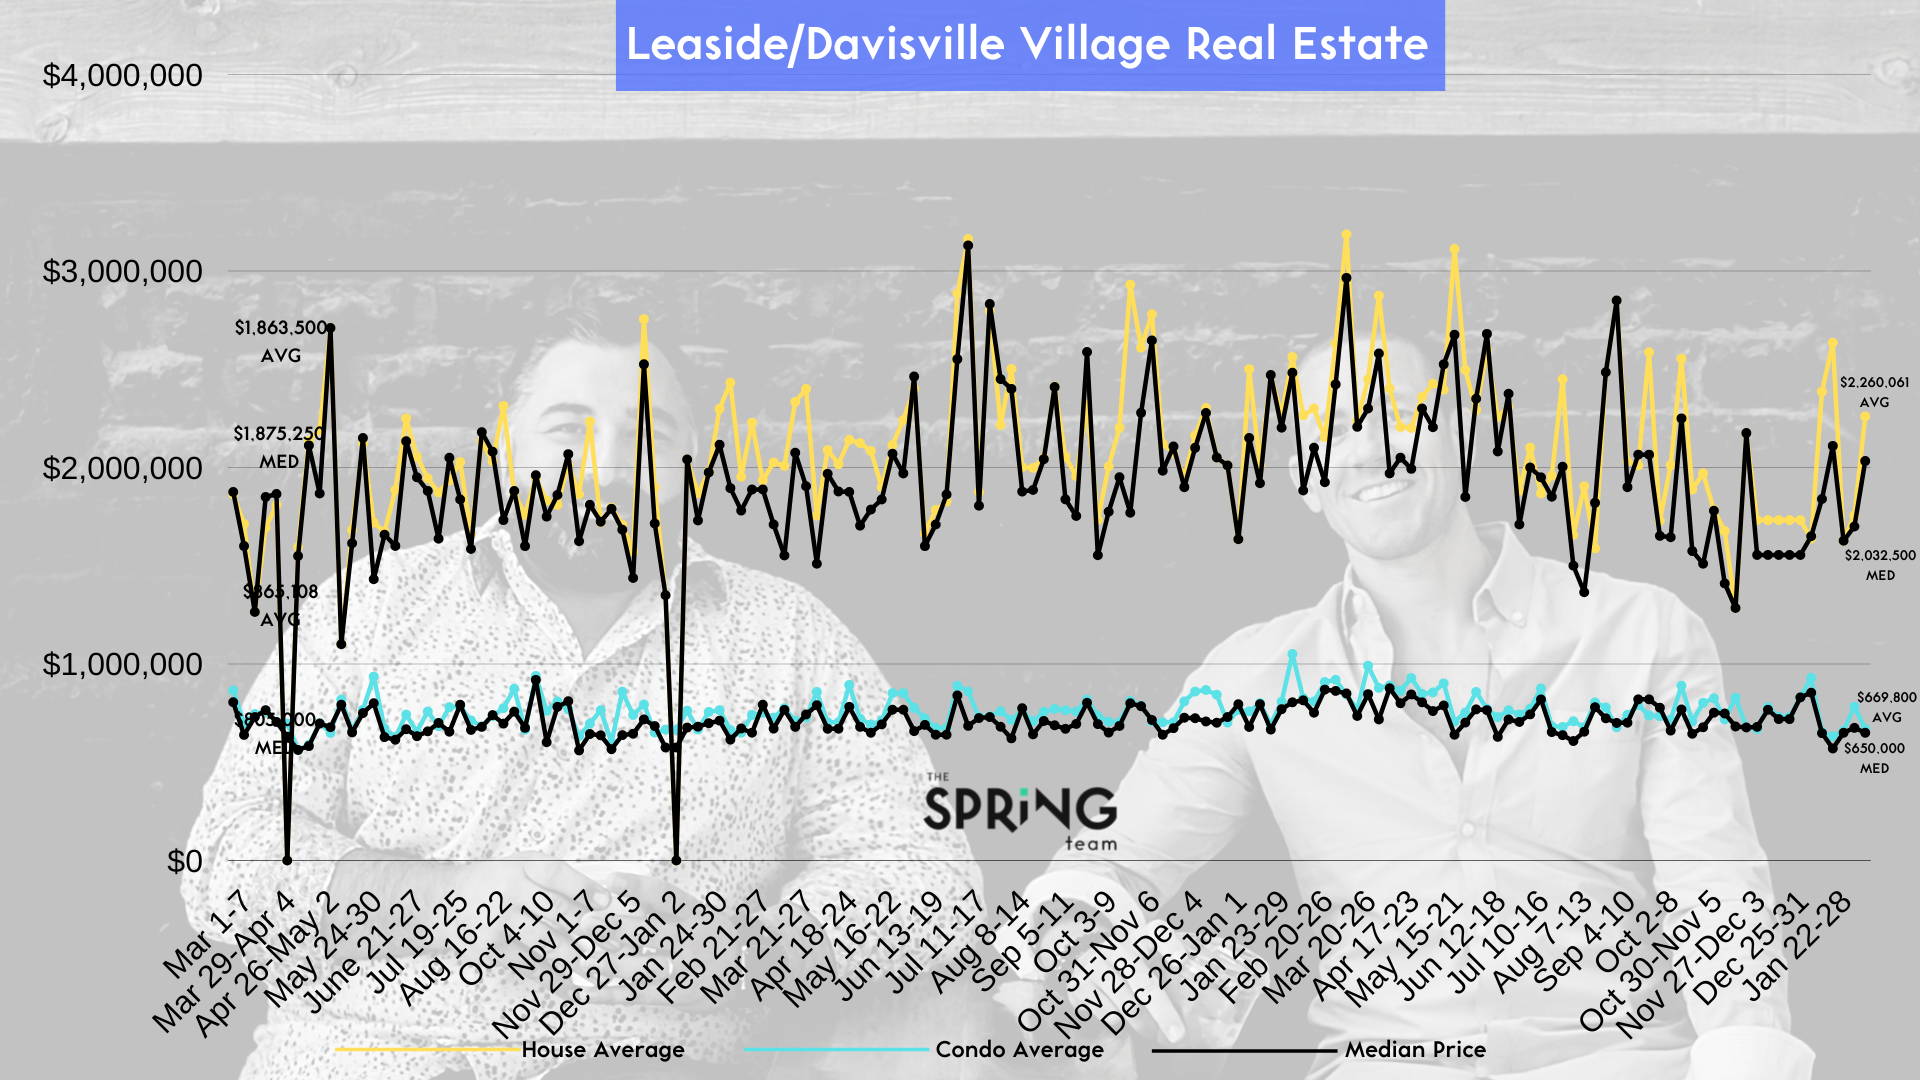
Leaside, Davisville, Yonge & Eglinton
House Average Price: $2,260,061
House Median Price: $2,032,500
25 Active Listings
12 Firm Sales This Week
MoI ~ 1.11 (up from 0.75)
Average Days on Market ~14
Condo Average Price: $669,800
Condo Median Price: $650,000
109 Active Listings
5 Firm Sales This Week
MoI ~ 2.01 (up from 1.61 last mth)
Average Days on Market ~ 26.40
Remember, we don’t have a bunch of panic sellers here in Toronto. So far, despite the record-breaking rate hikes, listing supply remains extremely low.
So when I say Yes and No to the Dead Cat Bounce question, I mean Yes, because we won’t sustain this short-term upward movement for more than a few months before things slow down and hold again. I don’t see prices being affected for the remainder of the year.
So those of you who have been waiting to time the market, you’ve missed the bottom. But there could be similar buying opportunities for you in the summer months…but with higher rates, so waiting may not make sense, especially if you’re looking for something specific. (continued after chart)
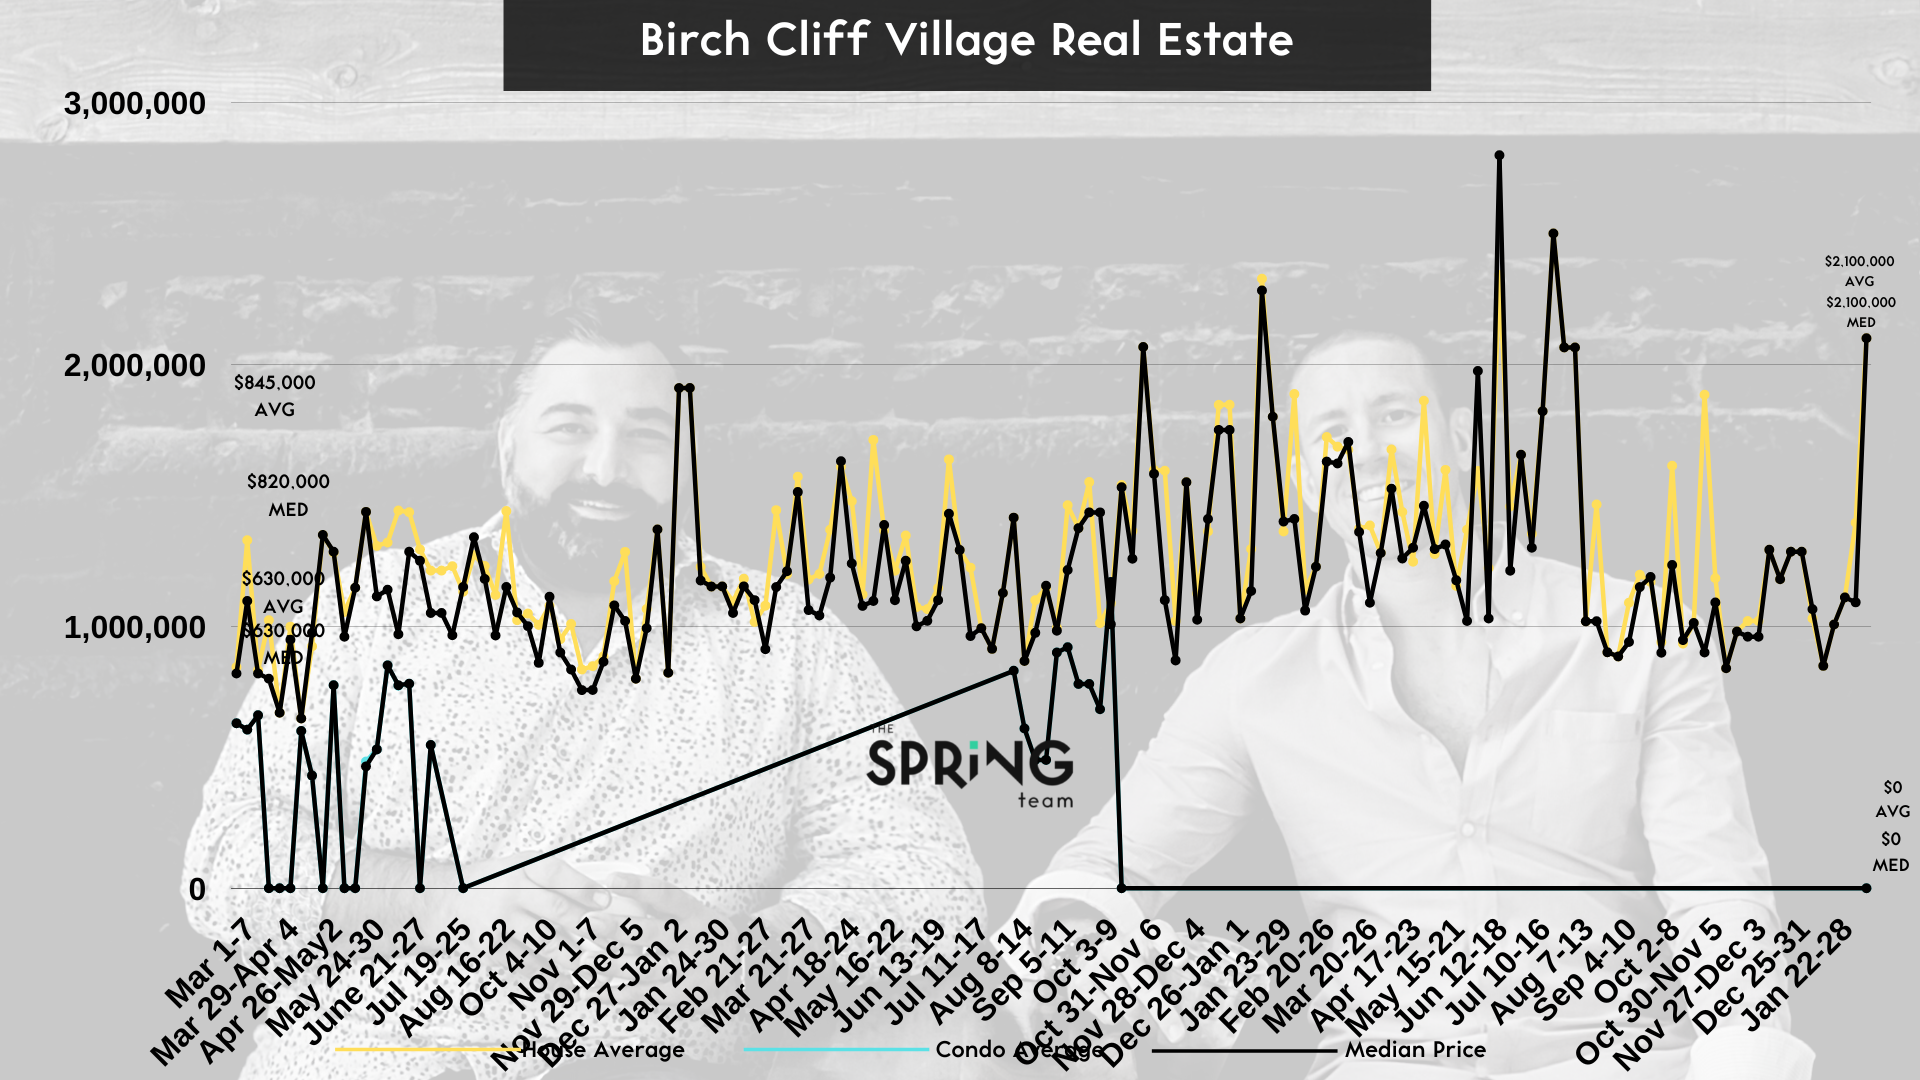
Birch Cliff
House Average Price: $2,100,000
House Median Price: $2,100,000
17 Active Listings
2 Firm Sales This Week
Months of Inventory (MoI) ~ 0.74 (down from 0.89)
Average Days on Market ~ 28
When will rates come down? I think that conversation will start in the Fall or toward the end of the Summer. Look at how many buyers came back to play after the January announcement…multiply that by 10 when rates start to come down.
This makes a lot of sense as someone who does this work daily and is deep in the numbers. So be careful who you’re getting your real estate information from. Some out there are just creating to get a reaction and create fear.
There’s no fear when you do the work.
Questions?
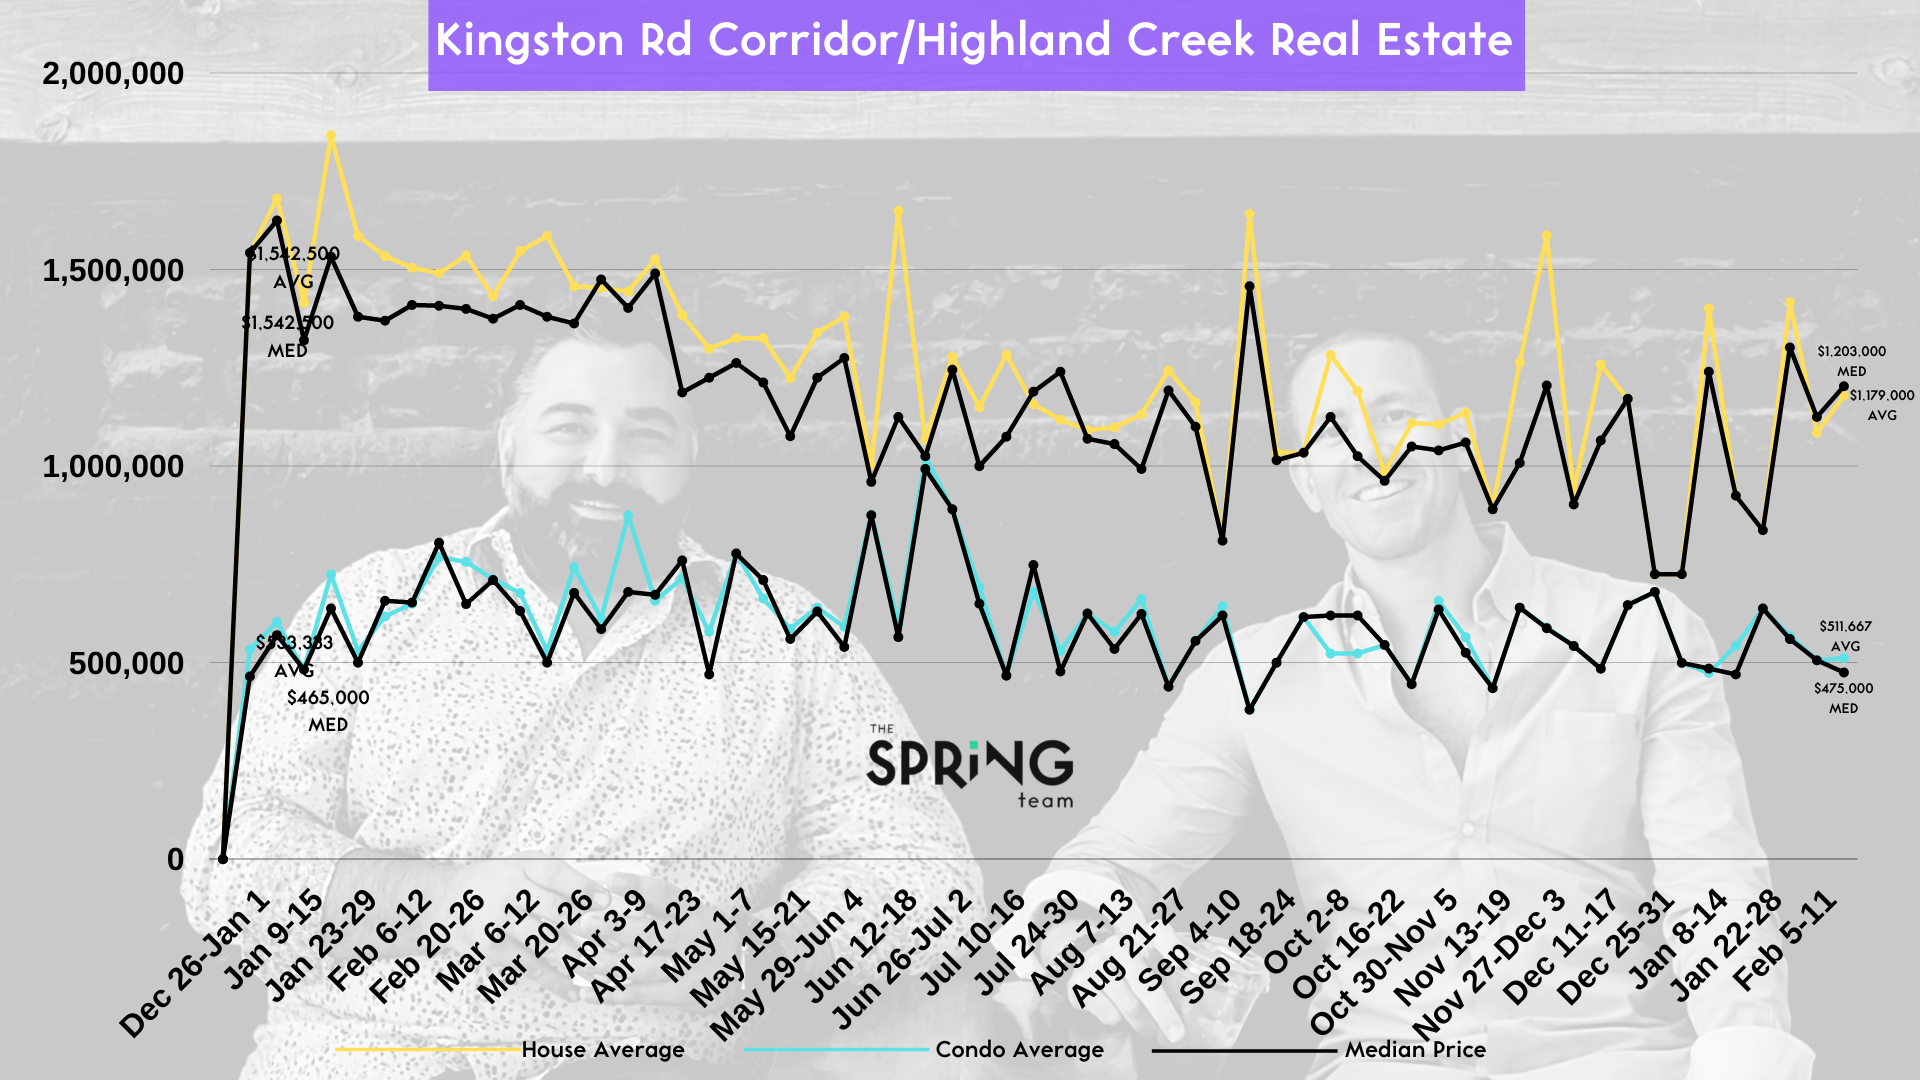
Kingston Rd Corridor to Highland Creek
House Average Price: $1,179,000
House Median Price: $1,203,000
42 Active Listings
4 Firm Sales This Week
Months of Inventory (MoI) ~ 0.74 (up from 0.54)
Average Days on Market ~8.75
Condo Average Price: $511,667
Condo Median Price: $475,000
43 Active Listings
3 Firm Sales This Week
MoI ~ 1.81 (up from 1.63)
Average Days on Market ~ 52.33
Have a wonderful day, and I’ll see you next week. Don’t forget to subscribe to the blog so you get this in your inbox asap, and we’ll see you on Youtube!
(please subscribe to the YouTube Channel here, where I go over all of these reports in more detail)