[ ] Hello and Happy Victoria Day, everyone! Week 11 is now done and settled so let’s dig into the numbers this week and see what’s changed.
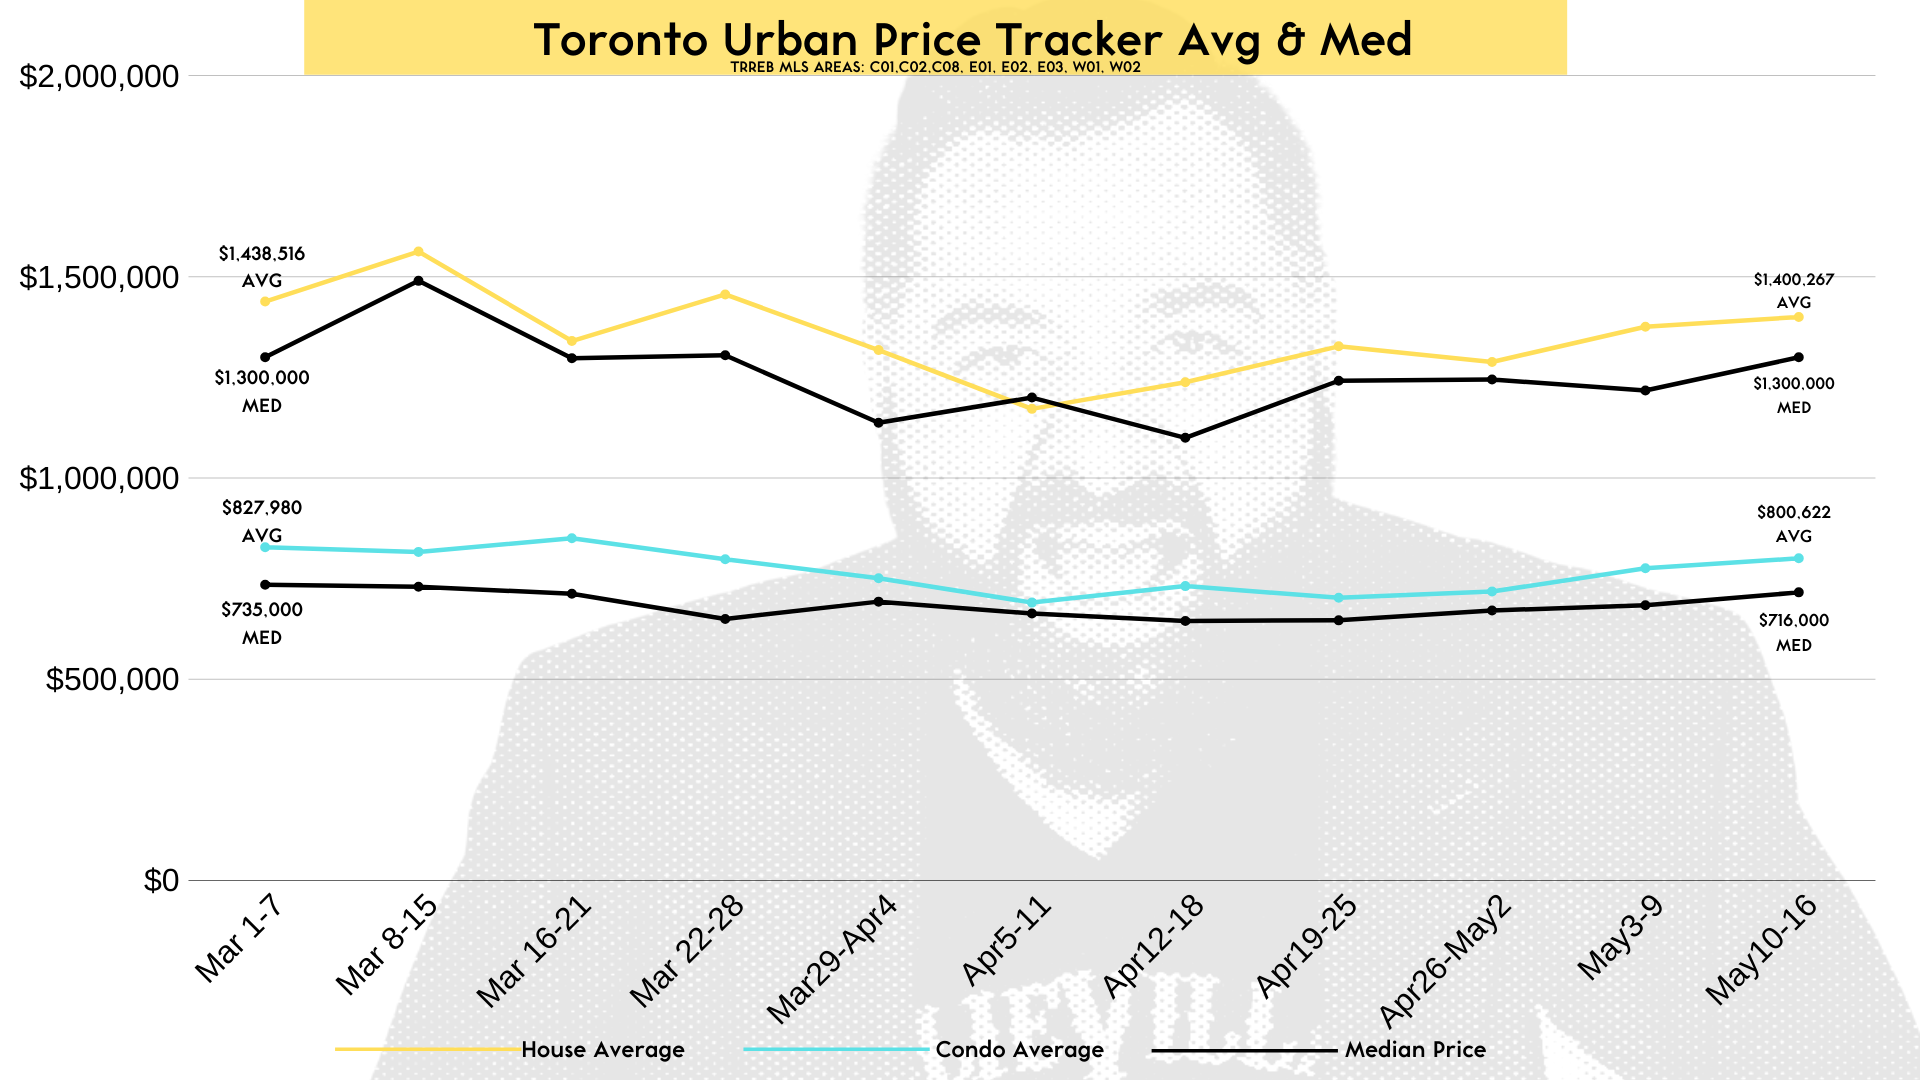
You’ll notice a new black line in my Urban Price Tracker below in the first comment. That’s Median Price.
Median Price is simply the sale in the middle. Half the homes sold for more, half for less. If there’s an even number then you average the two middle numbers. Simple.
I’ll be focussing quite heavily on median prices going forward as I feel it’s a better indicator of which way the market is trending (is it a Buyer’s or Seller’s market). It allows us to focus on the middle of the market, where most of the activity is.
I’ll be looking at the spread between Average Price and Median Price as well.
this week reported 36 sales (20 ). That’s a big jump from last week’s 26. Buyer confidence is still very strong and continuing to improve especially in the higher price points as the average price hit a high of $1.4m this week.
$ , , which has remained unchanged when compared to a “normal market” in the first week of March but 18% .
Long story short, the “House Buyer Party” is over in our urban communities for the moment. Sellers are mostly back in the driver’s seat and there aren’t too many discounts to be found on the market.
continue to hold steady in most buildings and communities with 43 firm sales (11 ).
The average sale price climbed to $800,622. This is a direct result of a ton of great sales in the $2M++ range which we’re starting to see more regularly now.
$ , which is down 2.6% from March 1st but 11% .
Condos under $700K are the ones attracting multiple bids in most cases so that market is still quite active while there are some bargain buys in the $700K+ markets especially for one bedrooms. Larger, higher priced one beds aren’t moving all that well at the moment.
Months of Inventory
I brought up MoI or Months of Inventory in my update from Week 8. At that time I was able to show a Seller’s market for Houses and a more balanced situation (if not more-so a buyer’s market) for condos.
What’s really interesting here is that Condos and Houses are being absorbed at pretty much the same rate. Condos are selling at 220.5 units per month and Houses at 220.8/mth.
Numbers based on April/May rates of absorption
Condo MOI May 2020
With 1113 available condos for sale that gives us approximately 5.5 months of inventory.
A healthy balanced market with many options for Buyers. Sellers are getting their properties sold but it’s taking at least a few weeks. Some buildings are a full Buyer’s market mode whilst others are still fetching multiple offers.
House MOI May 2020
With only 293 houses available for sale being absorbed at 220.8/mth that only leaves us with an extremely tight 1.33 months of inventory. This combined with the upward movement in both Average and Median prices indicates a full on Seller’s market in most urban communities.
That’s it for this week, folks! Thanks again for watching sharing, and the messages with your compliments, words of encouragement, and even the haters. Love you all equally 🙂
You can read about the difference in Average vs. Median on the blog here