Hello and Happy New Year!
None of the following should come as a surprise to you since I’ve been reporting some early figures in my year end update as well as the November 2017 update which came a bit late.
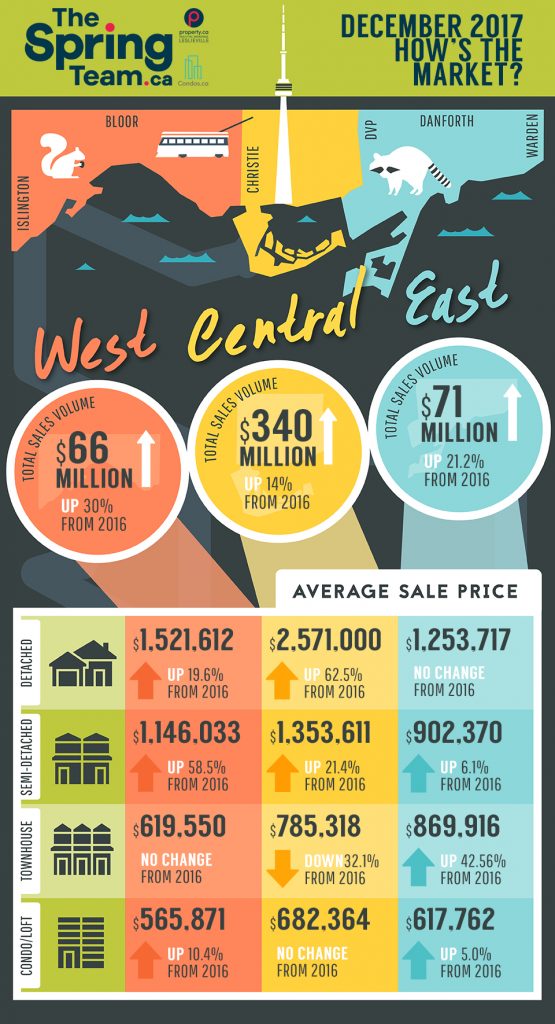
For your visual folks, scroll to the bottom to get a snapshot of the market on our downloadable infographic.
Unemployment, Inflation and Interest rates. Three things I neglected to mention in my previous two updates. A key indicator of the health of any market is the Unemployment Rate. 2017’s unemployment rate is down 14.4% from last year and will continue to drop as Tech in Toronto heats up and projects like First Gulf’s East Harbour attract more and more big business and employment to Toronto.
The Bank of Canada overnight lending is up to 1% from 0.5% this year and the Prime Rate is up to 3.2% from 2.7%. The Bank of Canada has stated that they have no interest in toying with interest rates throughout 2018 and with the new stress test, we’ll have buyers being approved at much higher rates and those that aren’t getting approved are being welcomed by non Federally regulated “B” lenders and private lenders. Business as usual.
Some notable numbers from the chart below:
Detached Homes
…In West End communities seemed to show the most gain at 19.6% year over year. Let’s ignore the figure from the central region as that’s due to an abnormally expensive single sale that’s skewed the yr/yr figure. The East End stayed relatively flat with some more inexpensive “handyman special” type detached lots brought down the average sale price here. You’ll see some significant jumps in that figure in a year as the finished products hit the market and sell.
Semi Detached Homes
…are up across the City with The West End showing an impressive 58.5% jump in value to $1,146.033. Both Central and East End also realized solid gains at 21.4% and 6.1% respectively. We’ll see this upward trend continue into 2018 as Freehold demand continues to outpace supply. I’d look to communities like East East Leslieville & Little India for your best value right now.
Townhouses
…remained flat in the West but we’ll see a LOT of new West End townhouse product hit the market as pre-con homes finish and are occupied and some resold. Wait for massive jump in value in the West. Central and East communities are already seeing huge gains in Townhouse pries (as predicted) of 32.1% and an enormous 42.5% respectively. I’d keep buying as many townhouses as you can possibly afford. They rent well and sell well. They’re the new investor special.
Condos & Lofts
The West and the East realized modest 10.4% and 5% respectively while the Downtown Core (central) was mainly flat this December. The December numbers aren’t indicative of how this asset class performed in 2017. Overall, condos are up nearly 60% in some communities when compared to average selling prices in 2016. Again, if you’re an investor…buy and hold your way to a healthy, wealthy retirement.
Thanks again for your attention! Feel free to download a PDF version of the below infographic. I know you’re going to want to print it out and put it on your fridge or something, right?
Have a great day!